U.S. Students Pursuing Study Abroad
II-61a: U.S. Postsecondary Students Participating in Study-Abroad Programs, Number and Percentage of Full-Time Students, Academic Years 1986–2013*
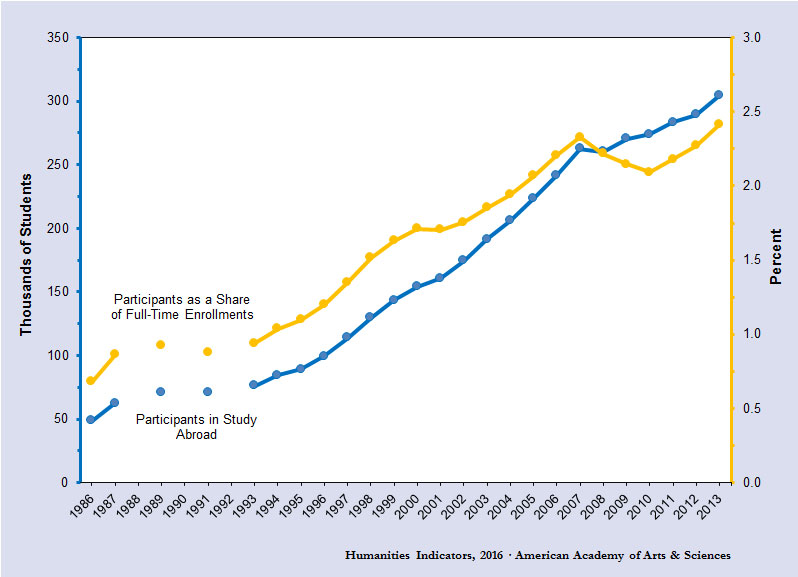
* Years given are for the first part of an academic year. For example, 2009 refers to academic year 2009–2010. Breaks in the trend lines indicate that data are not available for years 1988, 1990, and 1992.
Source: American Academy of Arts and Sciences, Humanities Indicators (www.humanitiesindicators.org). Study-abroad student counts obtained from: Institute of International Education, Open Doors (New York: Institute of International Education, 1987–2001); and Institute of International Education, “Profile of U.S. Study Abroad Students, 2003/04–2013/14,” http://www.iie.org/Research-and-Publications/Open-Doors/Data/US-Study-Abroad/Student-Profile/2003-14, accessed 10/1/2016. Enrollment data: U.S. Department of Education, Institute of Education Sciences, National Center for Education Statistics, Digest of Education Statistics, Table 303.10, http://nces.ed.gov/programs/digest/d14/tables/dt14_303.10.asp, accessed 10/1/2016.
* Years given are for the first part of an academic year. For example, 2009 refers to academic year 2009–2010.
Source: American Academy of Arts and Sciences, Humanities Indicators (www.humanitiesindicators.org). Plotted values obtained from Institute of International Education, Open Doors (New York: Institute of International Education, 2001–2003); and Institute of International Education, “Profile of U.S. Study Abroad Students, 2003/04–2013/14,” http://www.iie.org/Research-and-Publications/Open-Doors/Data/US-Study-Abroad/Student-Profile/2003-14, accessed 10/1/2016.
Source: American Academy of Arts and Sciences, Humanities Indicators (www.humanitiesindicators.org). Data provided by the Institute of International Education.
* Includes linguistics.
Source: Data provided by the Institute of International Education, and presented by the American Academy of Arts and Sciences’ Humanities Indicators (www.humanitiesindicators.org).
