History Degree Completions
- From 2012 to 2014, the number of bachelor’s and master’s degrees conferred in history fell 12.1% and 8.3% respectively (Indicator II-43a and Indicator II-43b). Conversely, the number of doctoral degrees conferred in the discipline rose 5.8% over the same time period (Indicator II-43c).
- With approximately 45,000 bachelor’s degrees awarded, 1971 was a banner year for the nation’s undergraduate history programs, the high point of a strong trend of increased enrollments during the latter half of the 1960s. But the number of history degrees began to drop the following year, reaching a nadir in 1985. The number subsequently increased—markedly so in the early 1990s and again beginning in 2002—bringing the number of bachelor’s degrees awarded in 2012 to 78.0% of the early-1970s high. With the subsequent decline, however, the number of history bachelor’s degrees fell in 2014 to 68.6% of the peak (30,810).
- History’s share of all bachelor’s degrees experienced a similarly sharp decline from the early 1970s through the mid-1980s and has remained well below the record levels reached in the late 1960s. Although history awarded 5.7% of all bachelor’s degrees in 1967, this share had decreased to 1.6% by 1985. Subsequent growth in the number of bachelor’s completions in history allowed history to surpass or at least keep pace with steady increases in the total number of bachelor’s degree completions, which kept history’s share in the vicinity of 2% of all bachelor’s degrees from 1986 to 2014 (when the discipline conferred 1.8% of all degrees).
- Similar to trends at the baccalaureate level, degree completions at the master’s and doctorate levels fell through the mid-1980s. At the master’s level, two waves of recovery, one cresting in 1995 and the other in 2012, did not bring master’s degree completions as close to their historic high as the recovery did at the undergraduate level. In 2014, the number of master’s degree completions in the discipline was 70.2% of the 1969 record. At the doctoral level, the number of history Ph.D.’s rose fairly steadily from the late-1980s through the 1990s but then declined through most of the 2000s. Since 2008, the number has increased in all but one year, bringing the number of doctorate completions to 1,043 in 2014, or 91.5% of the peak value recorded in 1973 (1,140).
- As with bachelor’s degrees, history’s share of all master’s and doctoral degrees declined dramatically over the 1970s and early 1980s and then remained close to this reduced level through 2014. In 2014, history degrees represented 0.5% of all master’s and first professional degrees, down from a high of 2.4% in 1967. At its height in 1970, history accounted for 3.5% of all Ph.D.’s, but in 2014 the discipline’s share was 1.6%.
II-43a: Bachelor’s Degree Completions in History (Absolute Number and as a Percentage of All Bachelor’s Degrees), 1966–2014*
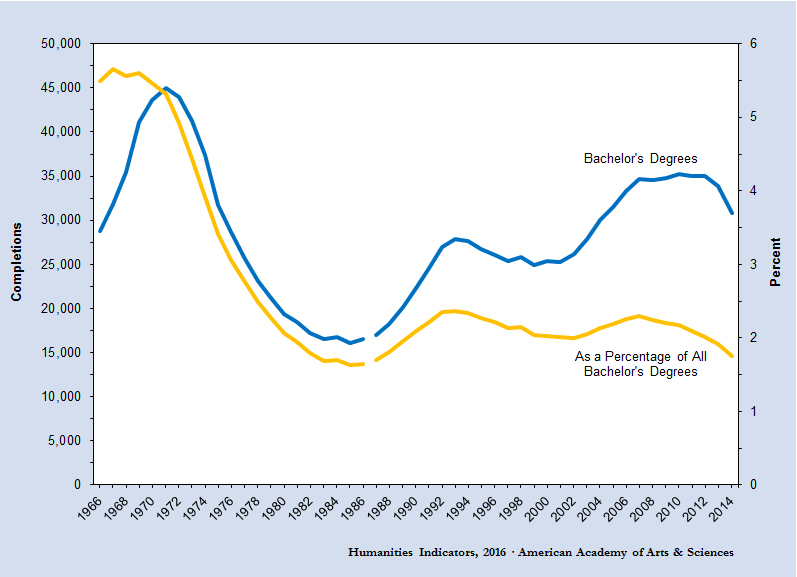
* The gaps in the trend lines for 1987 indicate a shift from the National Science Foundation’s disciplinary classification system to the National Center for Education Statistics’ Classification of Instructional Programs. Please see the Note on Data Used to Calculate Discipline-Specific Degree Counts and Shares for an explanation of the differences between the two systems. Degree counts do not include second majors.
Source: U.S. Department of Education, Institute of Education Sciences, National Center for Education Statistics, Integrated Postsecondary Data System; accessed via the National Science Foundation’s online integrated science and engineering resources data system, WebCASPAR.
See the Note on Data Used to Calculate Discipline-Specific Degree Counts and Shares. Data on the number of students completing minors are not gathered as part of the data collection program from which these degree completion counts are drawn, but such information was compiled for selected humanities disciplines as part of the American Academy of Arts and Sciences–sponsored Humanities Departmental Survey. See the Degree Program Code Catalog for an inventory of the specific degree programs included by the Humanities Indicators under the heading of “History.”
II-43b: Master’s Degree Completions in History (Absolute Number and as a Percentage of All Master’s and First Professional Degrees), 1966–2014*
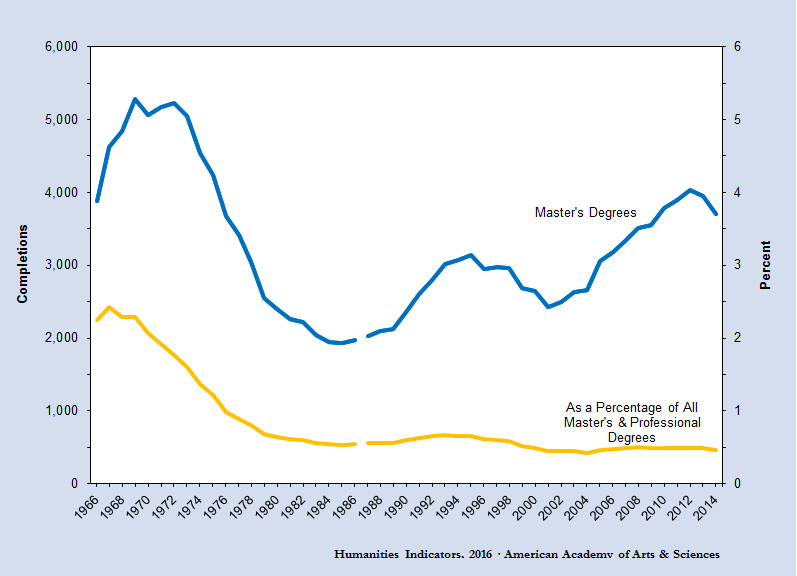
* The gaps in the trend lines for 1987 indicate a shift from the National Science Foundation’s disciplinary classification system to the National Center for Education Statistics’ Classification of Instructional Programs. Please see the Note on Data Used to Calculate Discipline-Specific Degree Counts and Shares for an explanation of the differences between the two systems.
Source: U.S. Department of Education, Institute of Education Sciences, National Center for Education Statistics, Integrated Postsecondary Data System; accessed via the National Science Foundation’s online integrated science and engineering resources data system, WebCASPAR.
See the Note on Data Used to Calculate Discipline-Specific Degree Counts and Shares and the Note on the Definition of Advanced Degrees. See the Degree Program Code Catalog for an inventory of the specific degree programs included by the Humanities Indicators under the heading of “History.”
II-43c: Doctoral Degree Completions in History (Absolute Number and as a Percentage of All Doctorates), 1966–2014*
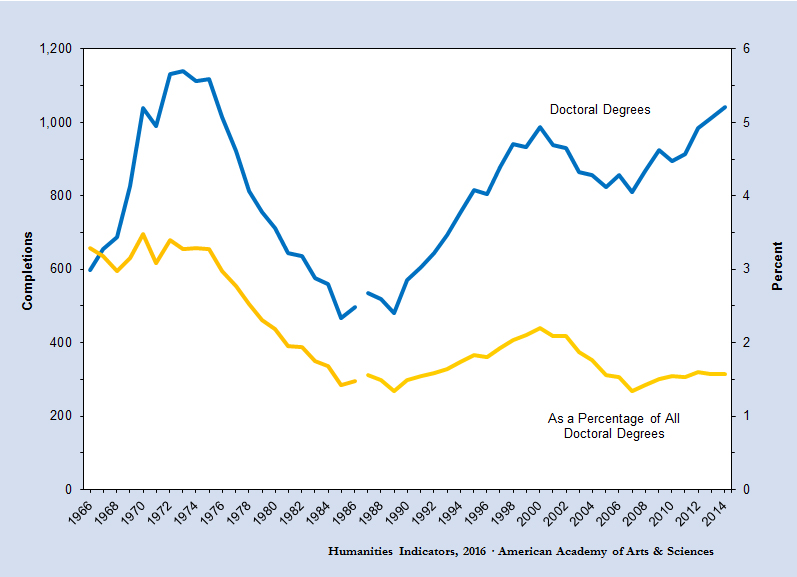
* The gaps in the trend lines for 1987 indicate a shift from the National Science Foundation’s disciplinary classification system to the National Center for Education Statistics’ Classification of Instructional Programs. Please see the See the Note on Data Used to Calculate Discipline-Specific Degree Counts and Shares for an explanation of the differences between the two systems.
Source: U.S. Department of Education, Institute of Education Sciences, National Center for Education Statistics, Integrated Postsecondary Data System; accessed via the National Science Foundation’s online integrated science and engineering resources data system, WebCASPAR.
See the Note on Data Used to Calculate Discipline-Specific Degree Counts and Shares and the Note on the Definition of Advanced Degrees. See the Degree Program Code Catalog for an inventory of the specific degree programs included by the Humanities Indicators under the heading of “History.”
