Overview of Findings from the 2012–13 Humanities Departmental Survey
Estimated Number of Humanities Departments, by Discipline, Fall 2007 and 2012
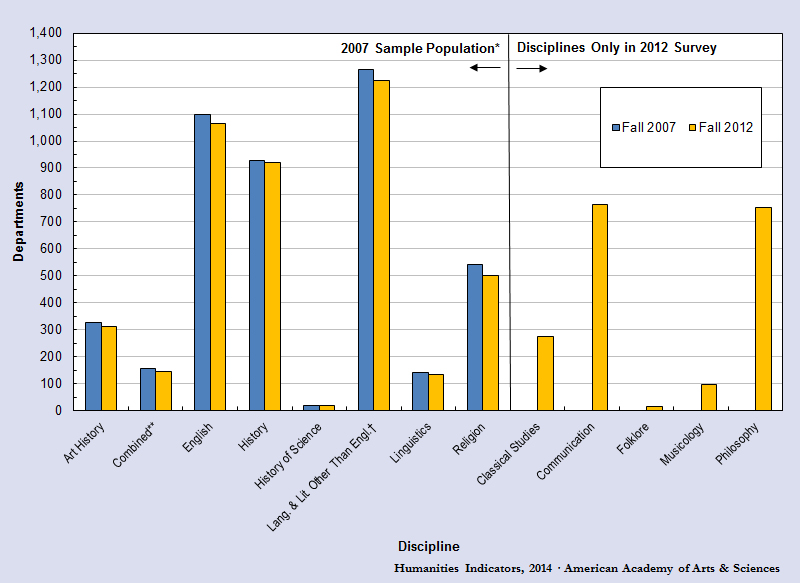
* For these disciplines, a representative sample of the departmental population was drawn in 2007. Data were collected for this same set of departments for both the 2007–08 and 2012–13 academic years. Because the sample did not include any departments created during the five years between the two surveys, the estimated totals for 2007 and 2012 should not be compared directly. The 2012 values can be interpreted as estimates of minima for the disciplinary totals for that year.
** A combined department is one that grants degrees in English and also in languages and literatures other than English.
† Some surveyed departments classified as being within languages and literatures other than English (LLE) for HDS-1 were reclassified as belonging to classical studies for HDS-2. Because the published HDS-1 value for LLE cannot be compared with that for HDS-2, the fall 2007 LLE value provided in this graph reflects the reclassification performed as part of HDS-2.
Source: Susan White, Raymond Chu, and Roman Czujko, The 2012–13 Survey of Humanities Departments at Four-Year Institutions, Tables 1a and b, pp. 4–5 (College Park, MD: Statistical Research Center, American Institute of Physics, 2014). Study conducted for the American Academy of Arts Sciences’ Humanities Indicators Project.
Number of Institutions Conferring Bachelor’s Degrees in History and English, Academic Years 2006–07 Through 2011–12*
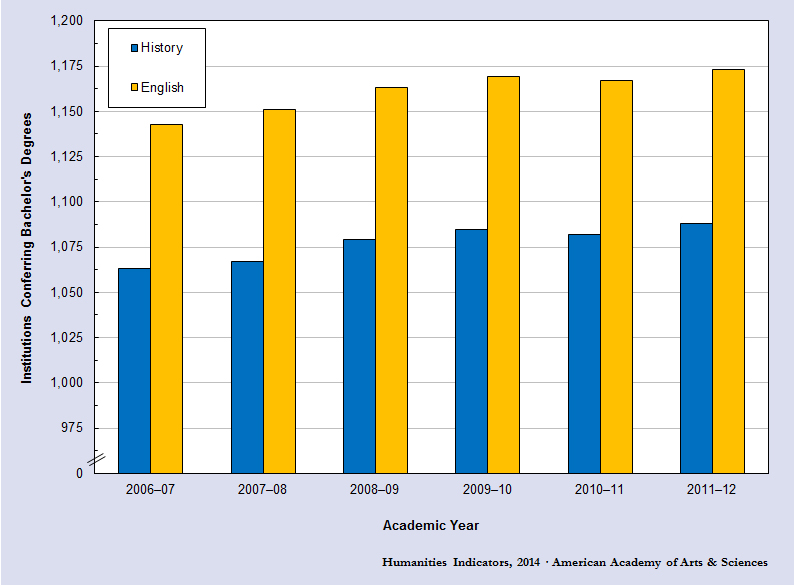
* To exclude degrees reported by colleges and universities that lack substantive programs in the subject, the tabulation excluded institutions that conferred fewer than 10 degrees in the previous three-year period.
Source: U.S. Department of Education, Institute of Education Sciences, National Center for Education Statistics, Integrated Postsecondary Data System; accessed via the National Science Foundation’s online integrated science and engineering resources data system, WebCASPAR.
Source: U.S. Department of Education, Institute of Education Sciences, National Center for Education Statistics, Integrated Postsecondary Data System; accessed via the National Science Foundation’s online integrated science and engineering resources data system, WebCASPAR.
Percentage of Humanities Departments Ceasing to Grant Degrees at Some Level, by Form of Institutional Control and Discipline, Fall 2007–Fall 2012*
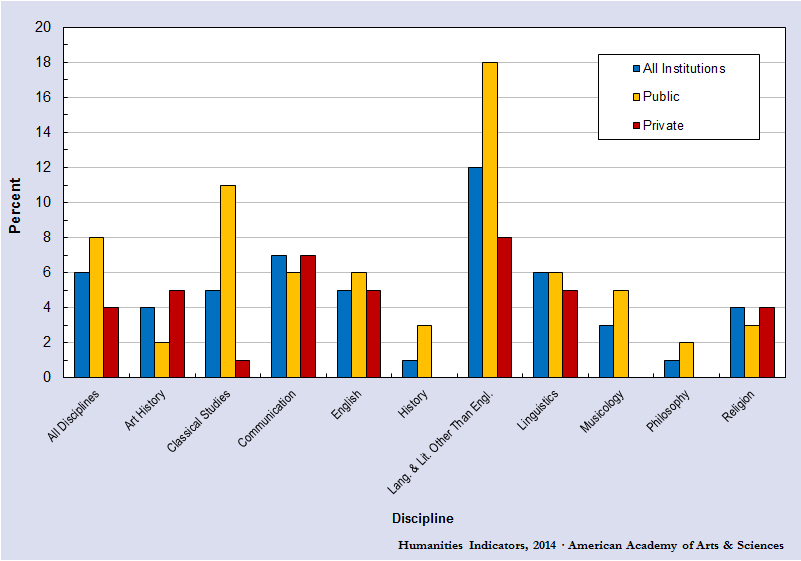
* History of Science and folklore were excluded from this graph because the estimate for every category of institution was either zero or of insufficient precision (the standard error associated with each estimate was more than 25% of the estimate's value). Combined departments were not included in this graph because there were too few respondents to provide a reliable estimates for every category of institution. (A combined department is one that grants degrees in English and also in languages and literatures other than English.)
Source: Susan White, Raymond Chu, and Roman Czujko, The 2012–13 Survey of Humanities Departments at Four-Year Institutions, Table 23, p. 32 (College Park, MD: Statistical Research Center, American Institute of Physics, 2014). Study conducted for the American Academy of Arts Sciences’ Humanities Indicators Project.
Source: Susan White, Raymond Chu, and Roman Czujko, The 2012–13 Survey of Humanities Departments at Four-Year Institutions, Table 23, p. 32 (College Park, MD: Statistical Research Center, American Institute of Physics, 2014). Study conducted for the American Academy of Arts Sciences’ Humanities Indicators Project.
Estimated Number of Humanities Faculty Members (Full- and Part-Time), by Discipline, Fall 2007 and 2012
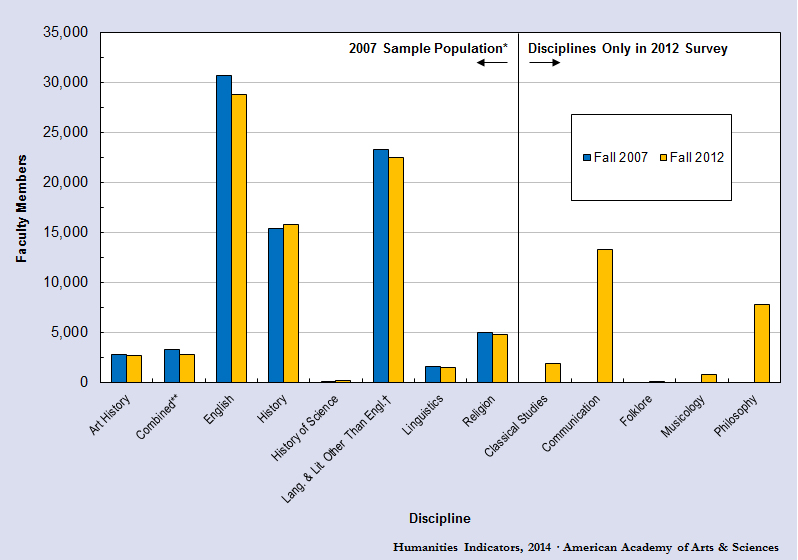
* For these disciplines, a representative sample of the departmental population was drawn in 2007. Data were collected for this same set of departments for both the 2007–08 and 2012–13 academic years. Because the sample did not include any departments created during the five years between the two surveys, the estimated totals for 2007 and 2012 should not be compared directly. The 2012 values can be interpreted as estimates of minima for the disciplinary totals for that year.
** A combined department is one that grants degrees in English and also in languages and literatures other than English.
† Some surveyed departments classified as being within languages and literatures other than English (LLE) for HDS-1 were reclassified as belonging to classical studies for HDS-2. To provide a direct comparison to the numbers reported in HDS-1, the estimate of LLE faculty members for 2012 presented in this graph includes those faculty members shifted to classical studies as part of the reclassification. As a result, some faculty members are counted in both LLE and classical studies for 2012.
Source: Susan White, Raymond Chu, and Roman Czujko, The 2012–13 Survey of Humanities Departments at Four-Year Institutions, Tables 1a and b, pp. 4–5 (College Park, MD: Statistical Research Center, American Institute of Physics, 2014). Study conducted for the American Academy of Arts Sciences’ Humanities Indicators Project.
Estimated Number of Juniors and Seniors with a Declared Major in the Humanities, by Discipline, Academic Years 2006–07 and 2011–12
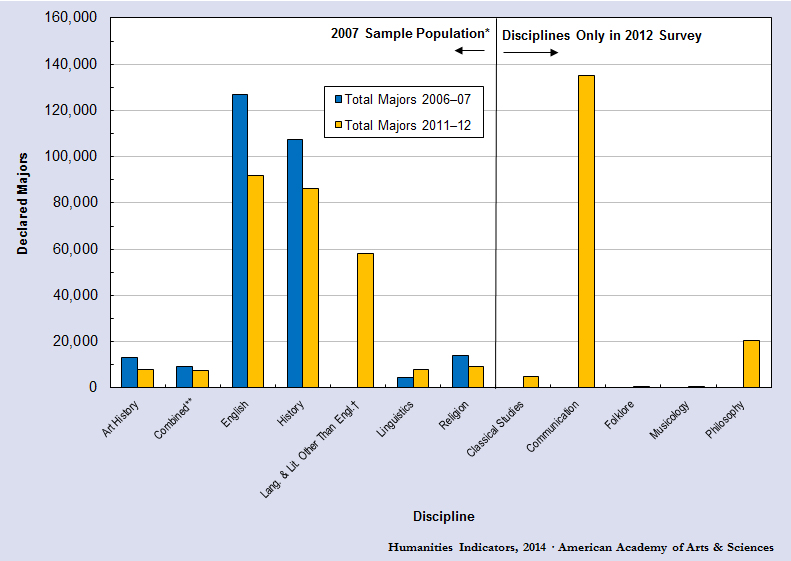
* For these disciplines, a representative sample of the departmental population was drawn in 2007. Data were collected for this same set of populations for both the 2007–08 and 2012–13 academic years. Because the sample did not include any departments created during the five years between the two surveys, the estimated totals for 2007 and 2012 should not be compared directly. The 2012 values can be interpreted as estimates of minima for the disciplinary totals for that year. For several disciplines, the estimated number of declared majors for 2012 was too small to display clearly on the graph. The number of declared majors for each of these disciplines is: folklore, 120; history of science, 210; and musicology, 390.
** A combined department is one that grants degrees in English and also in languages and literatures other than English.
† Because some surveyed departments classified as being within languages and literatures other than English for HDS-1 were reclassified as belonging to classical studies for HDS-2, the student totals for the two surveys are not comparable.
Source: Susan White, Raymond Chu, and Roman Czujko, The 2012–13 Survey of Humanities Departments at Four-Year Institutions, Tables 9a and b, pp. 16–17(College Park, MD: Statistical Research Center, American Institute of Physics, 2014). Study conducted for the American Academy of Arts Sciences’ Humanities Indicators Project.
Estimated Number of HDS-1 Departments and Faculty Members, Fall 2012:
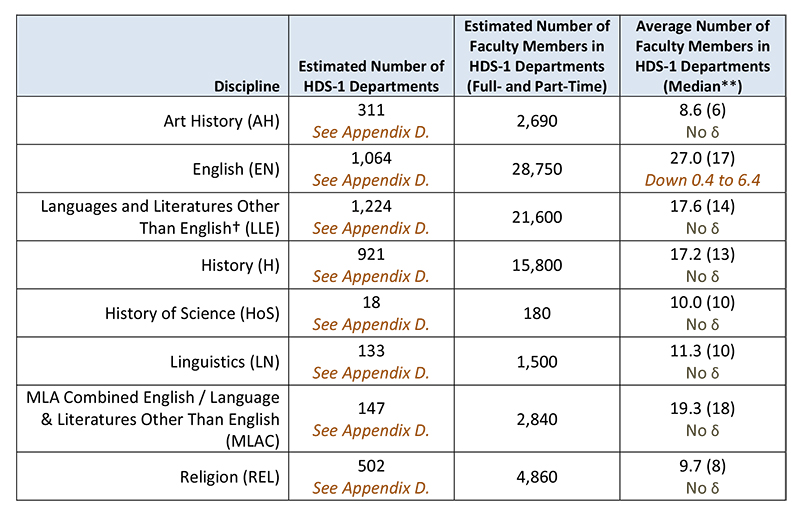
* Totals should not be compared directly with 2007 data since these totals do not include data for any departments that have been created in the interim. These totals can be interpreted as estimates of minima for all 2012–13 departments combined.
** The medians were not compared with medians from the previous study; no estimate of change is included.
† Some of the departments classified as LLE for HDS‐1 have been reclassified as Classical Studies for HDS‐2. Any comparisons are made using only departments classified as LLE for both HDS‐1 and HDS‐2.
Source: Susan White, Raymond Chu, and Roman Czujko, The 2012–13 Survey of Humanities Departments at Four‐Year Institutions (College Park, MD: Statistical Research Center, American Institute of Physics, 2014). Study conducted for the American Academy of Arts Sciences’ Humanities Indicators Project.
Estimated Number of Departments and Faculty Members, Fall 2012: New Disciplines Only
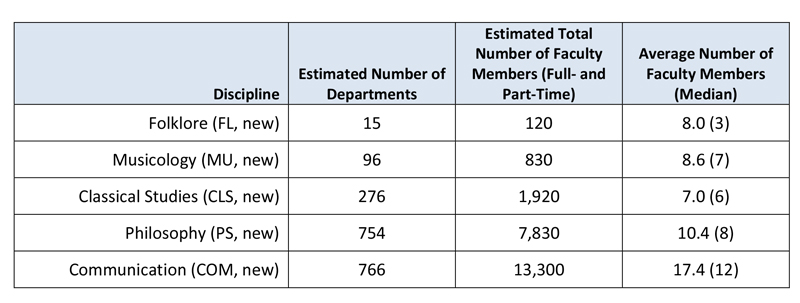
Source: Susan White, Raymond Chu, and Roman Czujko, The 2012–13 Survey of Humanities Departments at Four-Year Institutions (College Park, MD: Statistical Research Center, American Institute of Physics, 2014). Study conducted for the American Academy of Arts Sciences’ Humanities Indicators Project.
Information on this site is meant to be used and shared. Feel free to copy, distribute, and transmit text and images from the Humanities Indicators, with attribution.
