IV-08c: Percentage Change Fiscal Years 2008–2015 in Per Capita Amounts Appropriated by States for Their Arts Agencies, by State and the District of Columbia (Adjusted for Inflation)*
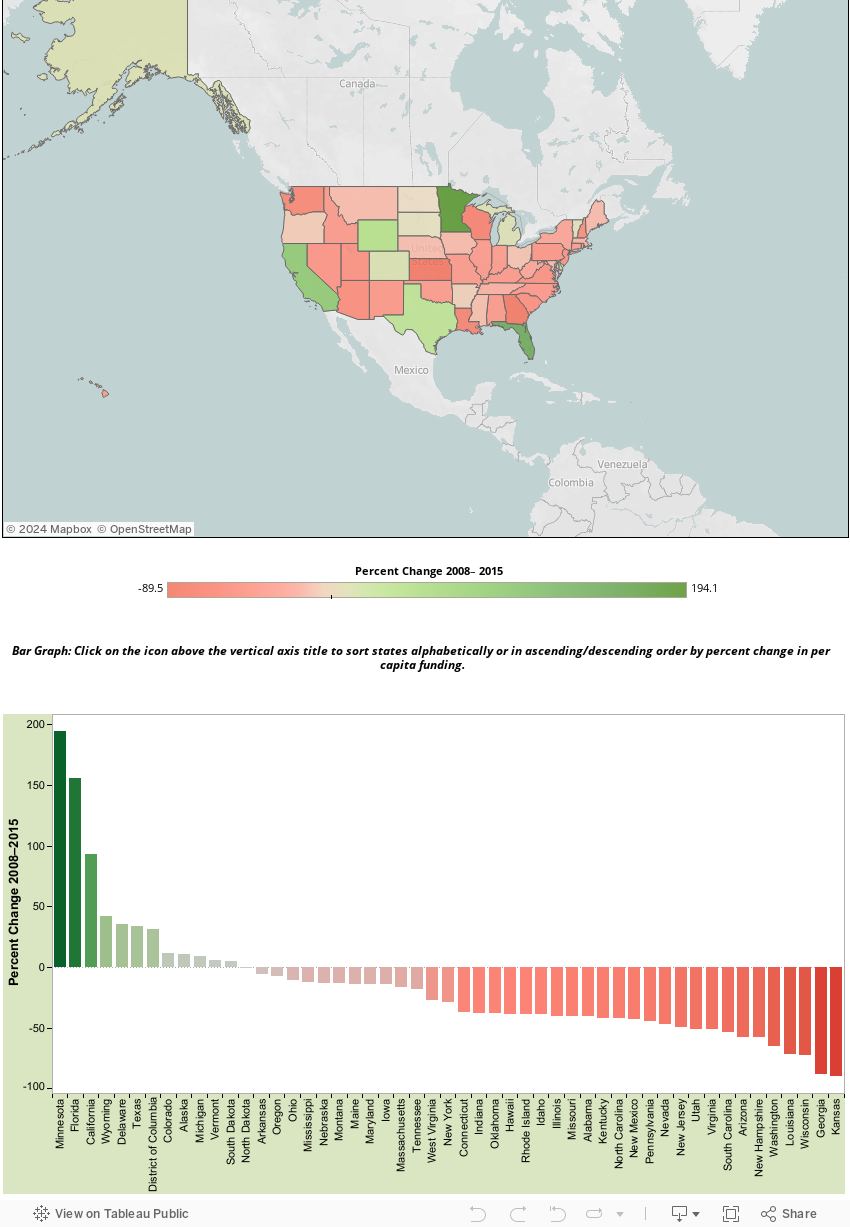
* Includes both base legislative appropriations and line items.
Source: National Assembly of State Arts Agencies, Annual Appropriations and Revenue Survey Data. Population data used to calculate per capita values are the estimates for July 1 of each year produced as part of the U.S. Census Bureau’s Population Estimates Program. Appropriations amounts were adjusted for inflation using the annual gross domestic product deflators (seasonally adjusted) produced by the U.S. Department of Commerce, Bureau of Economic Analysis. Deflators were downloaded from the website of the Federal Reserve of St. Louis at http://research.stlouisfed.org/fred2/series/GDPDEF/downloaddata?cid=21.
When Congress established the National Endowment for the Arts (NEA) in 1965, it required the agency to direct a portion of its funding to any state that established its own agency to promote the arts. Today every state has such an agency, and, although the NEA continues to fund them, the bulk of these agencies’ revenues comes from state legislatures (in contrast to state humanities councils, which are funded largely by federal dollars). These data are also of interest because a portion of arts agency funding is used to subsidize activities that are within the scope of the humanities as they are conceptualized for the purposes of the Humanities Indicators. For example, in 2012 the state arts agencies distributed $8.5 million to humanities projects, according to an analysis by the National Assembly of State Arts Agencies. The arts agencies also make awards for a wide array of other projects that benefit the humanities, such as preservation of and access to materials and collections and direct support of humanists for their work.
